

We use cookies for analytics and personalised content. Learn more here.
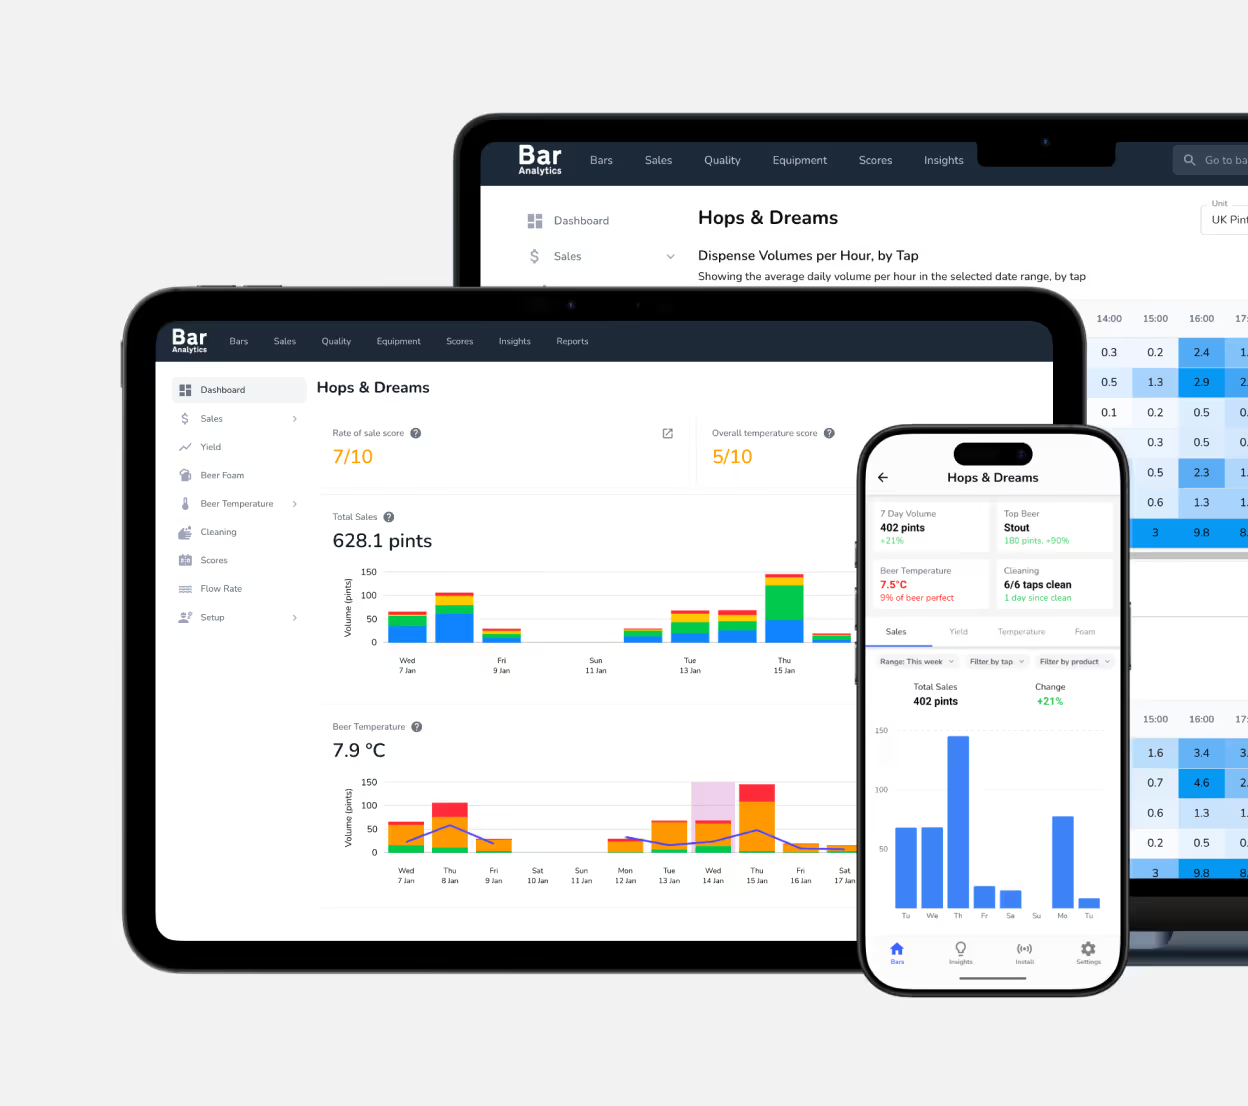
Bar Analytics gives you real-time visibility into the performance of beverage dispense — whether you’re at your desk, on the go, or building custom tools on top of your data. Access powerful analytics through our web app, mobile apps, or API, all backed by the same trusted data source.
Bar Analytics is designed to meet you where you work. Choose the access method that fits your workflow—or use all three together.


Our web app is the most powerful way to explore, analyze, and manage your data.
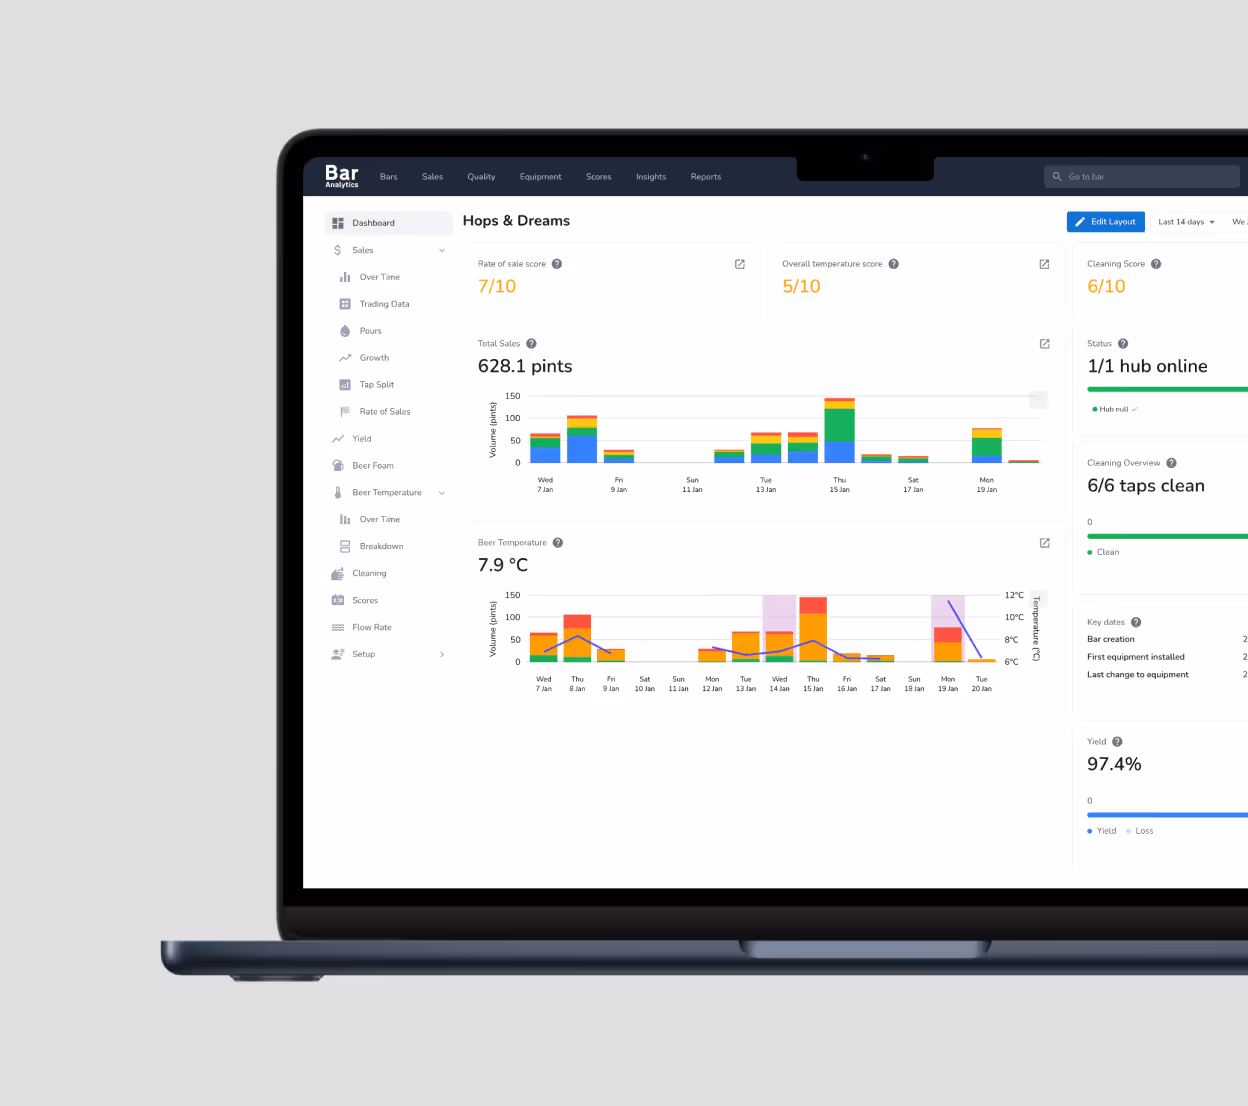
Interactive dashboards – Visualize sales, temperature data, cleaning routines and product detection alerts at a glance.
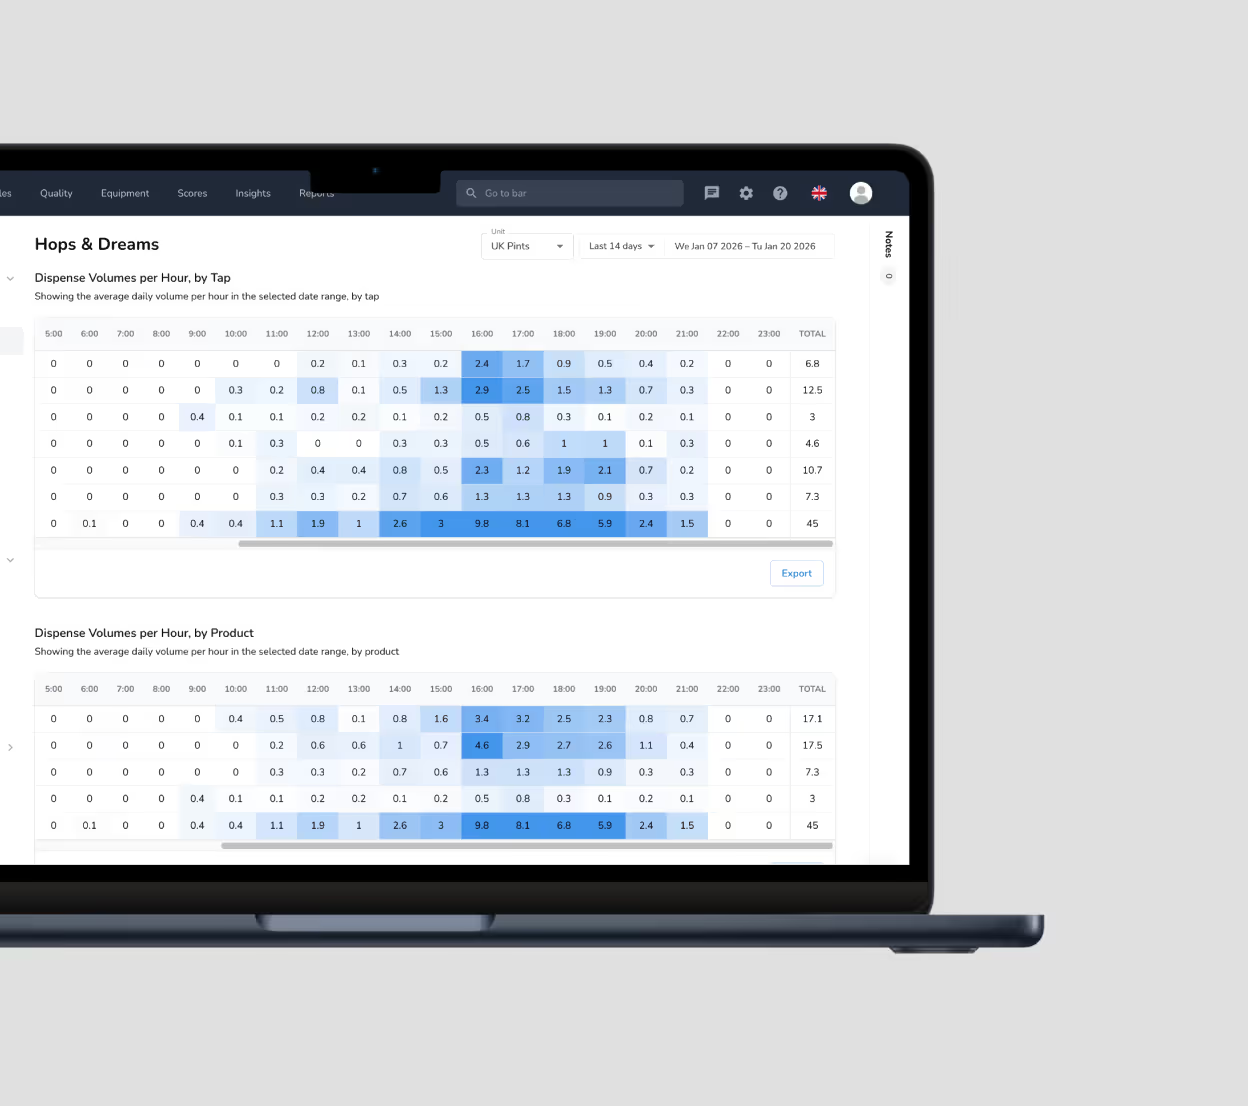
Real-time data - Our data platforms receive sensor data within 3 minutes, allowing rapid responses to alerts.
Aggregated data - The dashboards allow you to view data for a single tap, or aggregated data across tens of thousands of taps covering millions of pours, all in seconds. No more long waits!
Historical data analysis – Track performance over time and spot long-term trends. Data is kept for years allowing multi-year comparisons.
Alerts – Easily spot anomalies across tens of thousands of taps. Our custom notification engine generates smart alerts to keep your sales on track and detect quality issues.
Export & sharing tools – Download reports into Excel, CSV or PDFs to share insights with your team.
Customisable – Our in-house team of developers respond quickly to customisation requests to support you with the tools needed for your brands.
Granular role-based access – Control who can view or manage data across your organization, including via SAML login.
Stay connected to your data wherever you are. The Bar Analytics mobile app gives you instant access to the metrics that matter most.
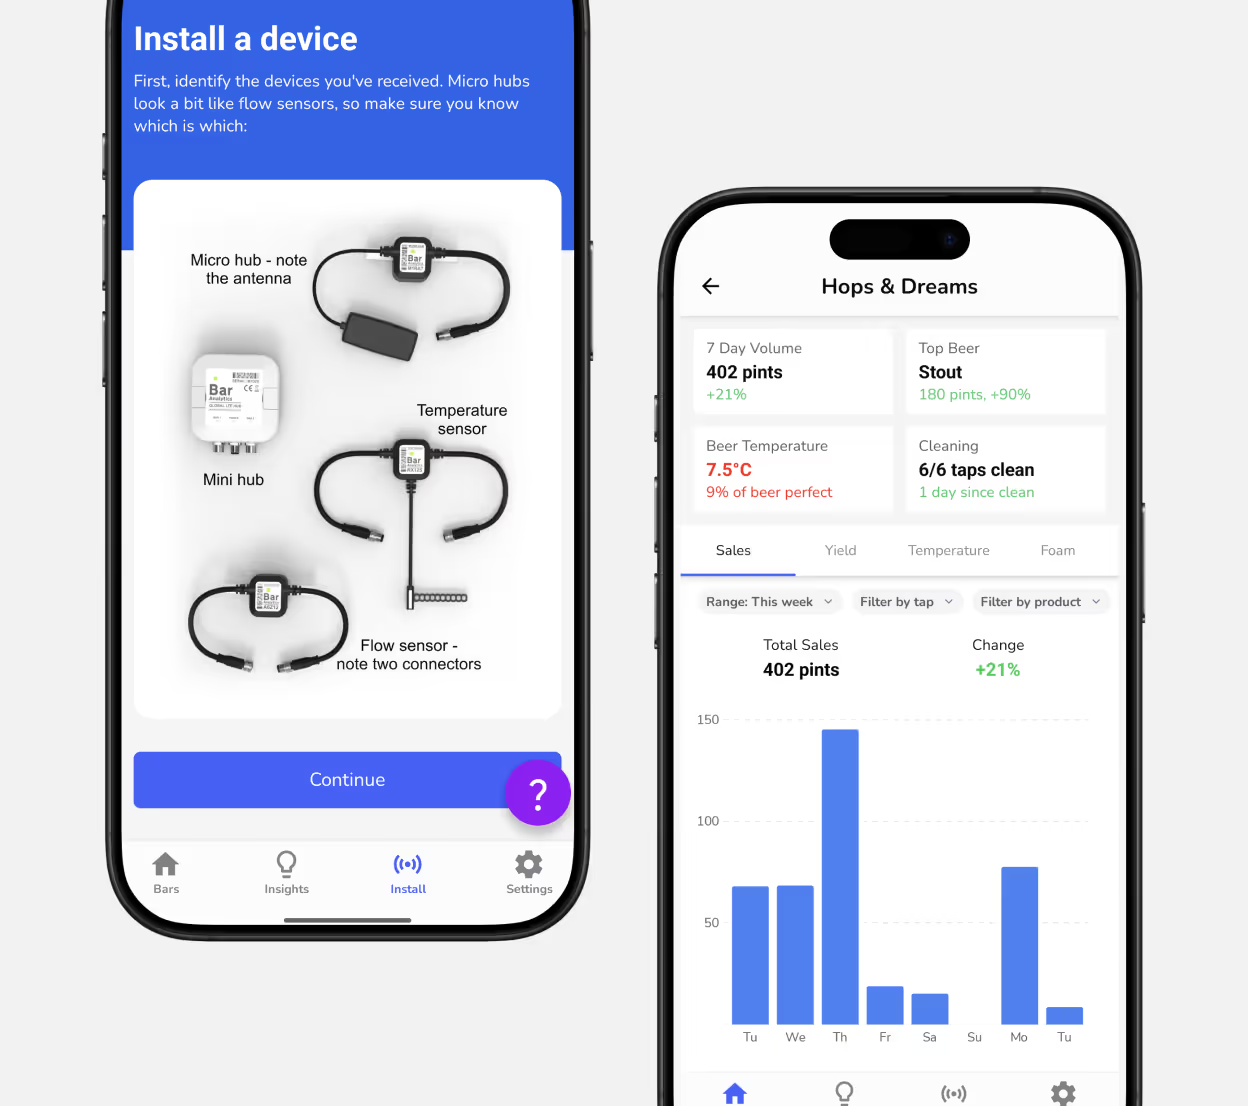
Custom alerts & notifications – Get notified when key metrics change
Mobile-optimized dashboards – Clean, fast views designed for small screens
Quick insights on the go – Perfect for owners, managers, and field sales teams
Ideal for checking performance, responding quickly, and staying informed without opening a laptop.
For teams that want full flexibility, Bar Analytics offers a robust API to integrate analytics directly into your own tools and workflows.
Programmatic data access – Pull real-time and historical data
Secure authentication – Protect your data with industry-standard security
Flexible integrations – Connect to BI tools, internal dashboards, or third-party systems
Scalable & reliable – Designed for production-level usage
Best for developers, data teams, and businesses building custom analytics experiences
No matter how you access Bar Analytics—web, mobile, or API—you’re always working from the same accurate, up-to-date data.
Analyze deeper. Move faster. Make smarter decisions.
Order a Trial KitHere's some of the most frequent questions we get asked by potential customers and where to find extra information.

All data is available in near real time through the Bar Analytics web app, mobile apps for iOS and Android, or via API for integration with internal systems, dashboards, or reporting tools.
Yes. Data is streamed and processed every 2 minutes, allowing near real-time visibility of dispense activity, equipment status, and operational metrics, subject to network conditions and configuration.
All data is transmitted and stored securely using industry-standard encryption and access controls. User permissions and roles ensure that only authorized users can access sensitive data.
Yes. The Bar Analytics platform is designed for large-scale deployments and already supports tens of thousands of devices and locations with centralized configuration, monitoring, and reporting.
Yes. The Bar Analytics API allows data to be integrated into internal systems, BI tools, data warehouses, and third-party platforms. We can also push alerts into third-party systems, for example automatically creating technician jobs for faults.
Industry leading beer insights start here